If you have the required permissions, you can modify the dashboard components according to your needs. At the top right corner of the dashboard there is a menu with an option to “Modify Dashboard”.
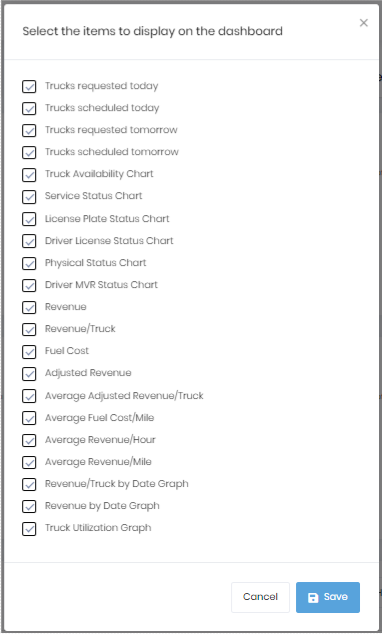
When clicking on the “Modify Dashboard” menu option will display a list that allows you to hide or show the desired components.
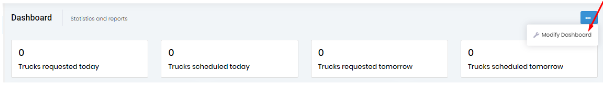
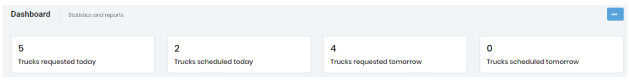
The “Trucks requested today”, “Trucks scheduled today”, “Trucks requested tomorrow” and “Trucks scheduled tomorrow” components provide a quick overview of the number of trucks needed for today and tomorrow as well as the number of trucks scheduled.
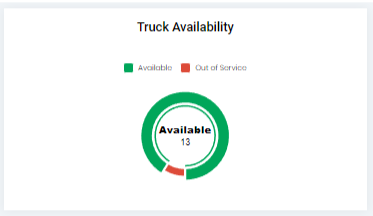
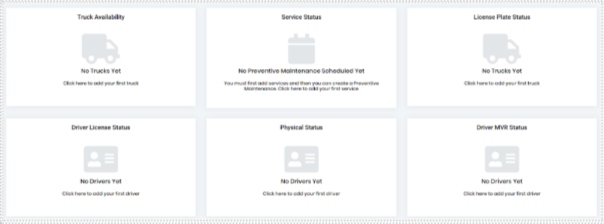
The Truck Availability Chart helps you to know the number of trucks that are available and out of service. If you click on this component, you will get redirected to the “Trucks” view.
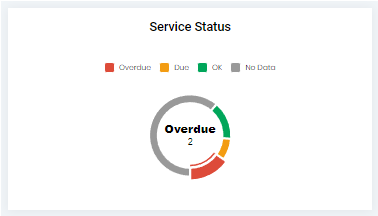
The Service Status Chart provides an overview about your trucks service status.
The red color segment shows the number of active trucks that have any preventive maintenances that were due on a past date.
The orange color segment shows the number of active trucks that have any preventive maintenances that are within the range of miles or hours and have no overdue maintenance.
The green color segment shows the number of active trucks that have preventive maintenance scheduled but none of them are “Due” or “Overdue”.
The grey color segment shows the number of active trucks that don’t have any preventive maintenances scheduled.
If you click on this box, you will get redirected to the “Preventive Maintenance Schedule” view
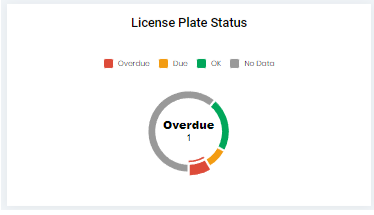
From License Plate Status Chart, you can get an idea about your trucks' license status based on the color of the segment.
When you click on this box, you will get redirected to the “Trucks” view.
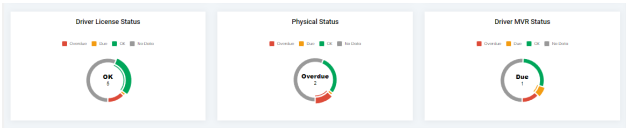
If you add “Driver License Status Chart,” “Physical Status Chart” and “Driver MVR Status Chart” to your dashboard you can see the driver DOT requirements. When clicking on the box, you will get redirected to the “Drivers” view.
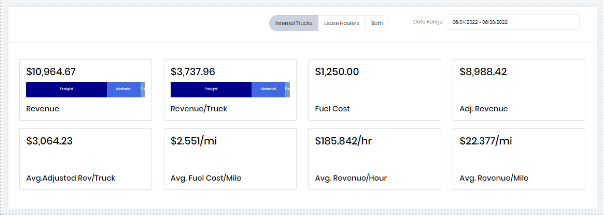
By adding Revenue, Revenue/Truck, Fuel Cost, Adjusted Revenue, Average Adjusted Revenue/Truck components you can get a real time view of your revenue details. You can filter it with Date range and also by Internal Trucks/Lease haulers/Both options.
The Revenue and Revenue/Truck bars will be split into two segments Freight and Material. Hovering over each segment will show its contribution to the total.
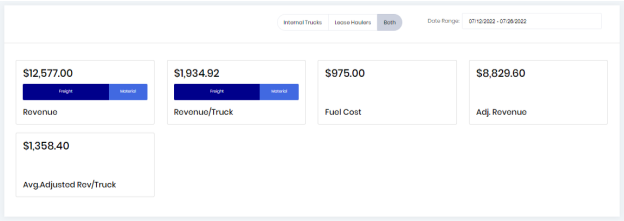
If the “Show Fuel Surcharge” checkbox is enabled, then the Revenue and Revenue/Truck components there will be a fuel segment and hovering over that portion will show its contribution to the total.
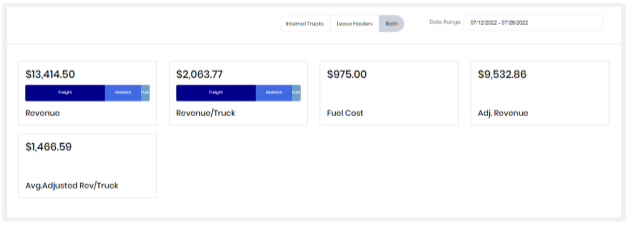
The Adjusted Revenue will be calculated as Revenue - Fuel Cost - Labor Cost.
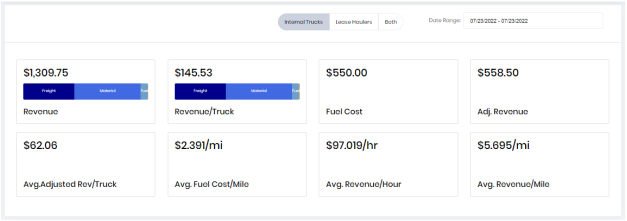
Average Fuel Cost/Mile, Average Revenue/Hour and Average Revenue/Mile components are displayed only if GPS is integrated.
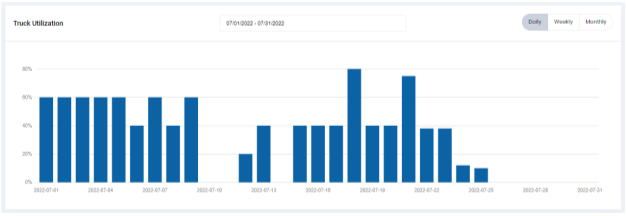
The Truck Utilization Graph shows a graph of the utilization of the trucks. You can check the utilization of trucks for a particular date range by selecting the date range first. This section is only displayed if the setting “allow associating tickets with order items” is checked on general tab of the settings.
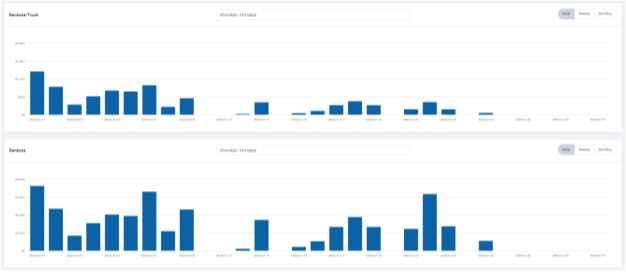
The Revenue bar graph will be based on your total revenue. The Revenue/Truck component takes into account the actual number of active trucks you had on each day. You can choose to display the Revenue graph and Revenue/Truck graph by day, week, or month.
When no data is available these components it will show as follows. Clicking these images will take you to the appropriate setup screen.
There are also numerous revenue graphs that allow you to see revenue related calculations for the specified time frame specified on the component.
The last 3 components are only displayed for the tenants that have GPS integrated as that data is necessary to calculate these items.
If you aren’t tracking fuel cost in the system, the fuel cost value will always be $0.