How do you know if a job or customer is profitable? Do you know which drivers generate the most revenue or which trucks are underperforming?
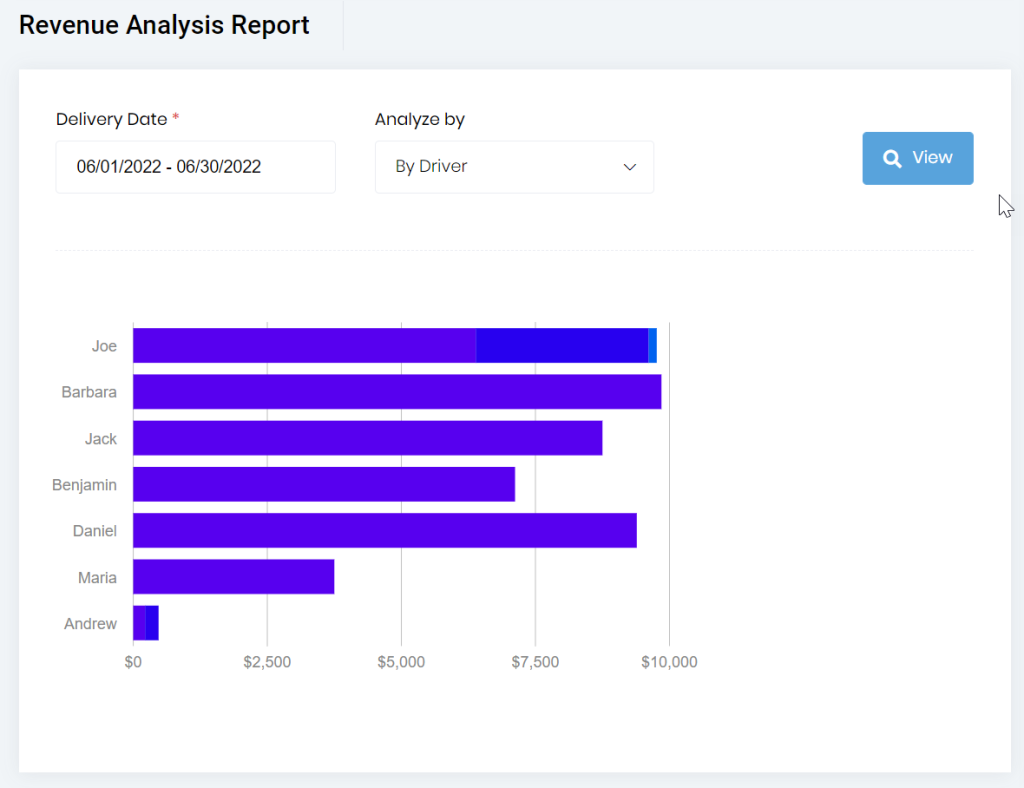
Dump Truck Dispatcher makes it easy to get this information. For example, the below image shows the revenue by driver. All these revenue numbers are updated in real-time as tickets are added to the system. The revenue is broken out into 3 parts: freight, material, and fuel surcharge. Each portion of the revenue is a different color on the bar.
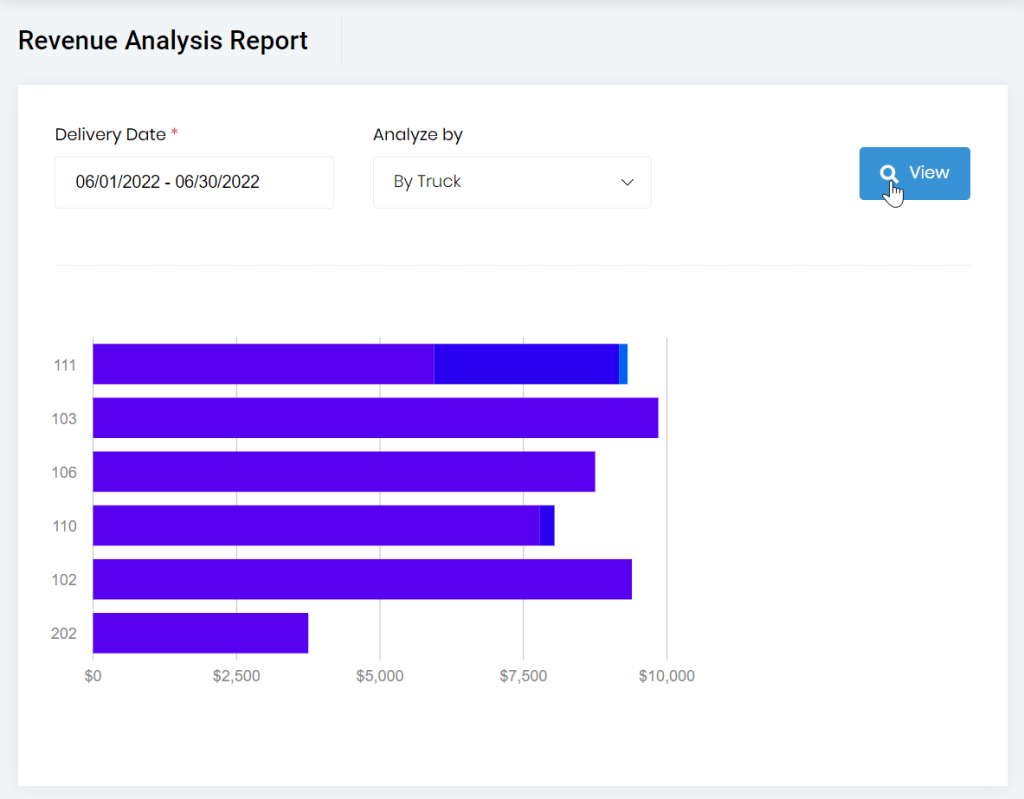
The below image shows the "Revenue by Truck" graph, which is similar to the "Revenue by Driver" graph.
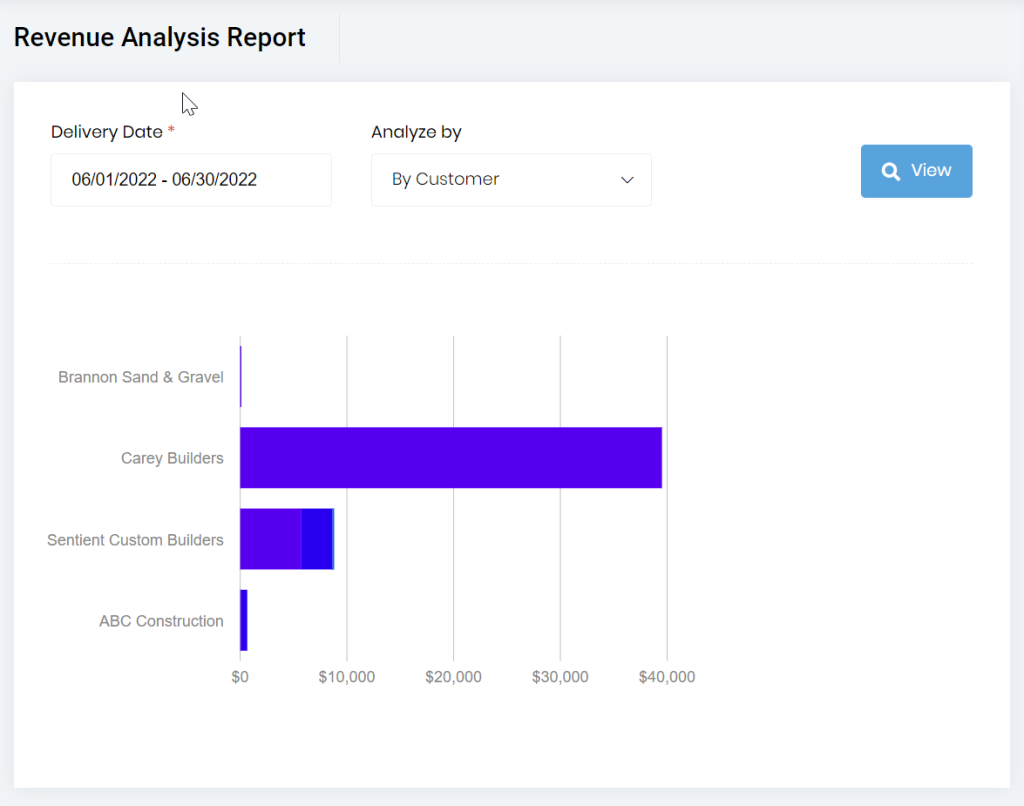
Below is the "Revenue by Customer" report.
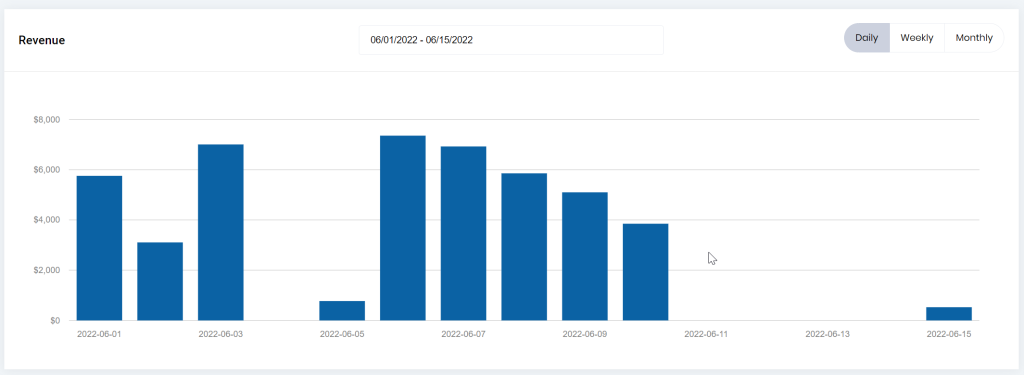
If you want to look at your revenue by date, you can find it on the dashboard or by pulling the report under the revenue analysis. Below is an image of the "Revenue by Date" graph. You can also aggregate the data by week or month on the dashboard.
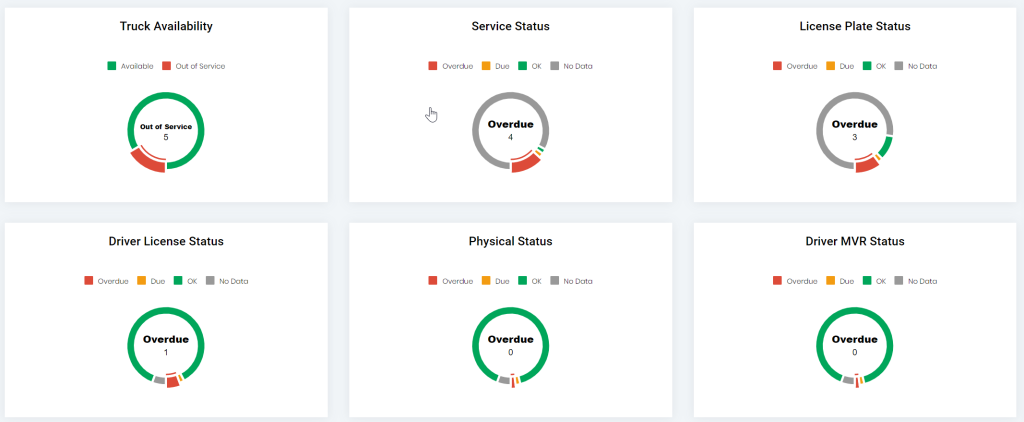
In addition to several revenue graphs on the dashboard, the dashboard also provides a view to show when trucks are out of service, missing plates, or overdue. It also makes it easy to tell when drivers are overdue for various DOT requirements such as their license renewal or expired physical. Green means good, yellow means they are due, and red means they are overdue.
These are just a few of the many available reports and components that can help keep your business on track.
