It is a snapshot of all the valuable metrics in the form of graphs and charts. It accumulates information for all your devices and provides you with a summary.

The dashboard shows both live information such as how many of the units are online and offline, how many are moving and parked, and historical information for a specified period, such as mileage of your fleet fuel consumption, etc.
To navigate to the dashboard, first, go to the top right corner of the tab and then select the dashboard tab.
Note that if you have access to 100 units, then the dashboard will automatically open up upon logging into the platform. The dashboard subtab is customizable.
To open the configuration panel, select the menu button by clicking on the three dots on the top right corner. There you will see the configuration options.
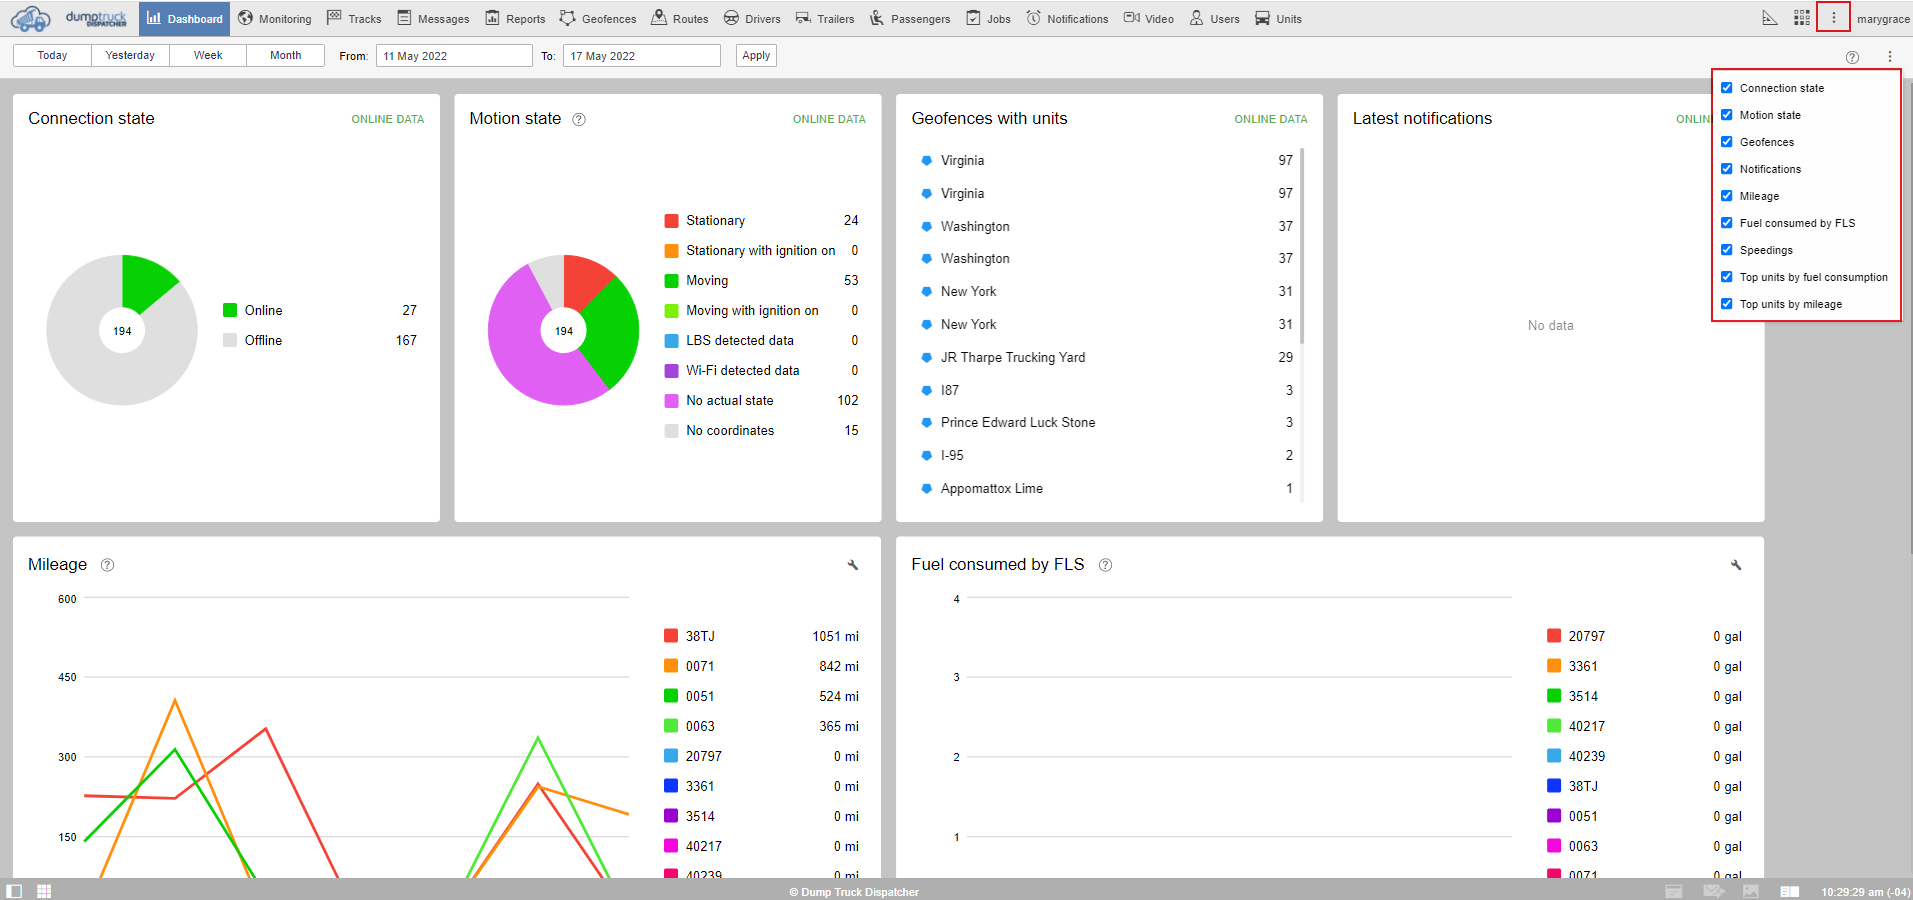
You can either reorganize the blocks by selecting the vertical arrows and dragging them up or down, the layout of the dashboard is totally up to the user depending on which block is more important for the business.
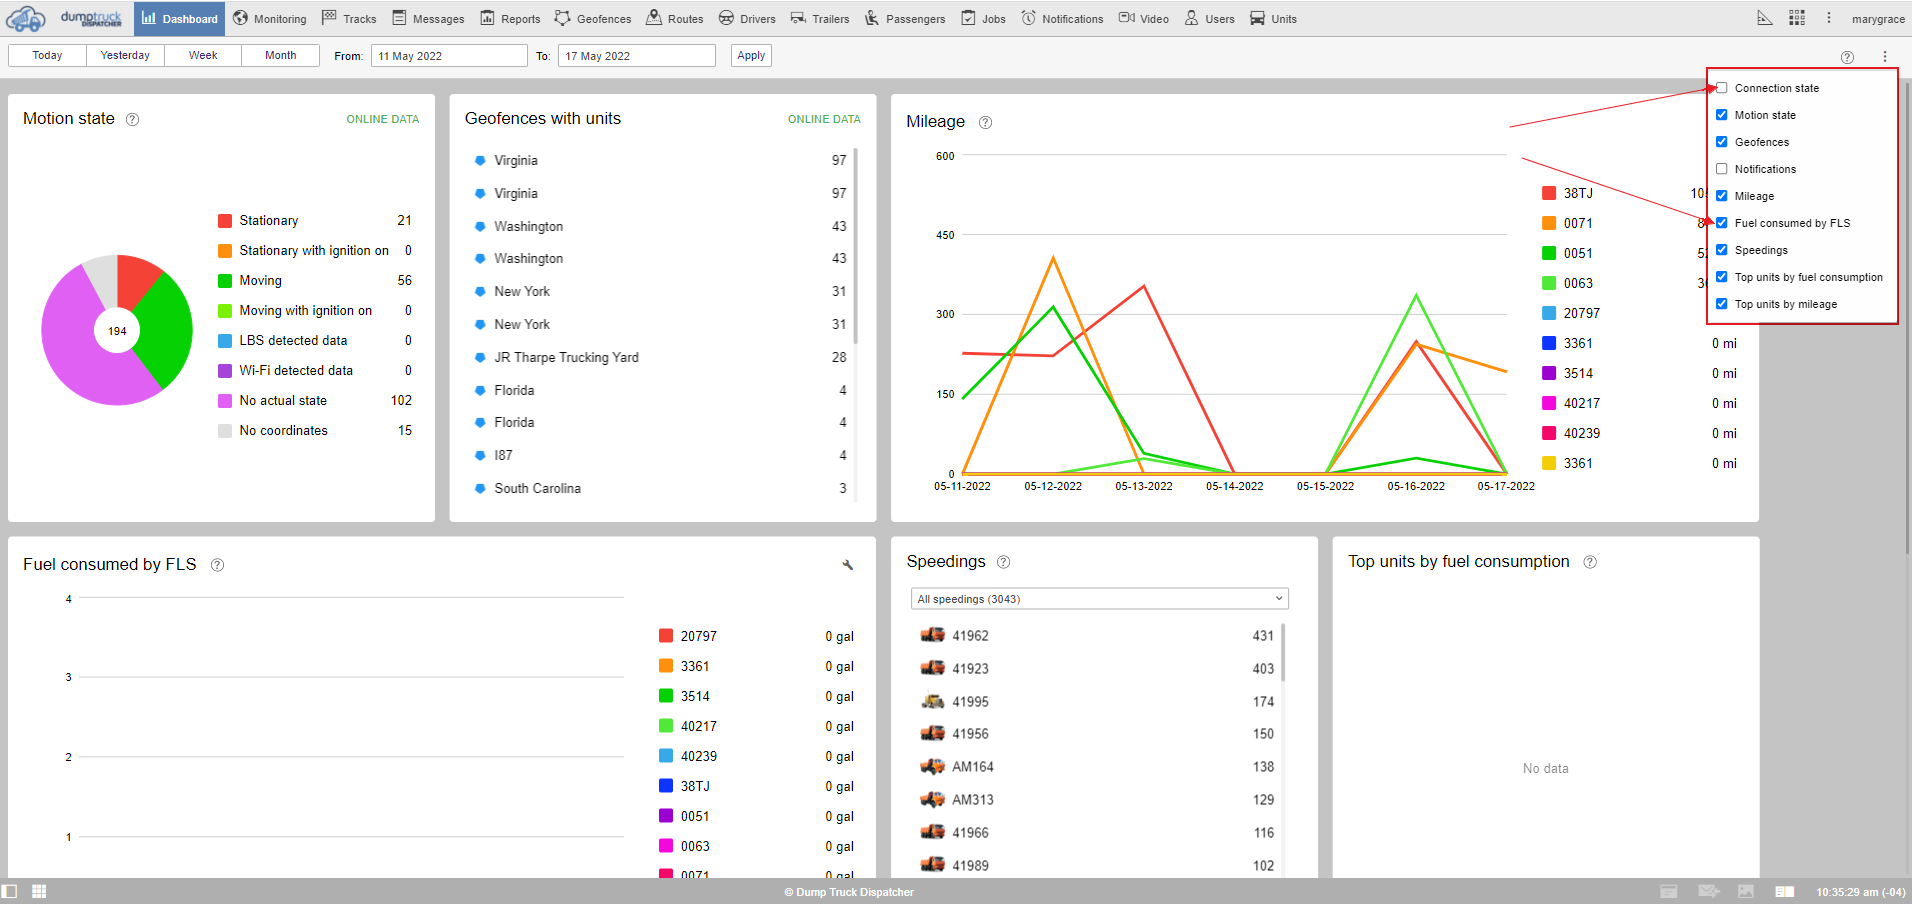
You can also add and remove blocks by selecting the check box to the left of the panel's name.
Some dashboard panels provide live data while others give historical data.
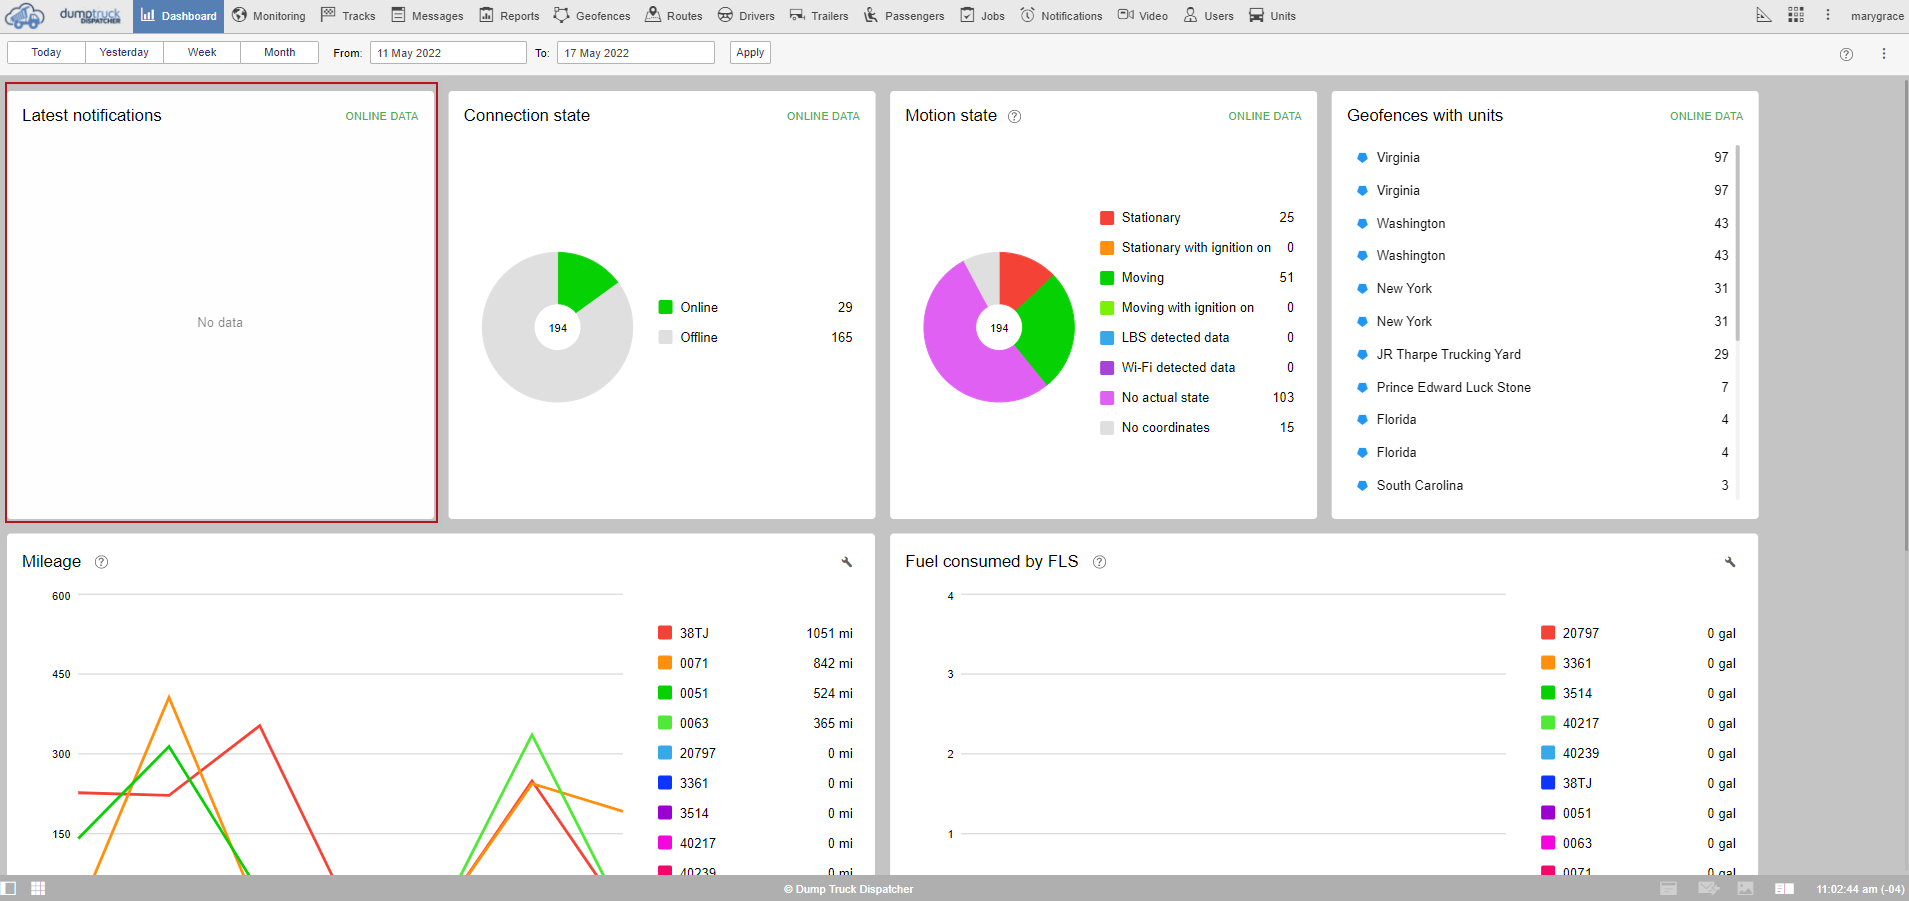
As you can see below there are four blocks that show live data. The connection state, Motion state, Geofences with units, and the latest notifications.
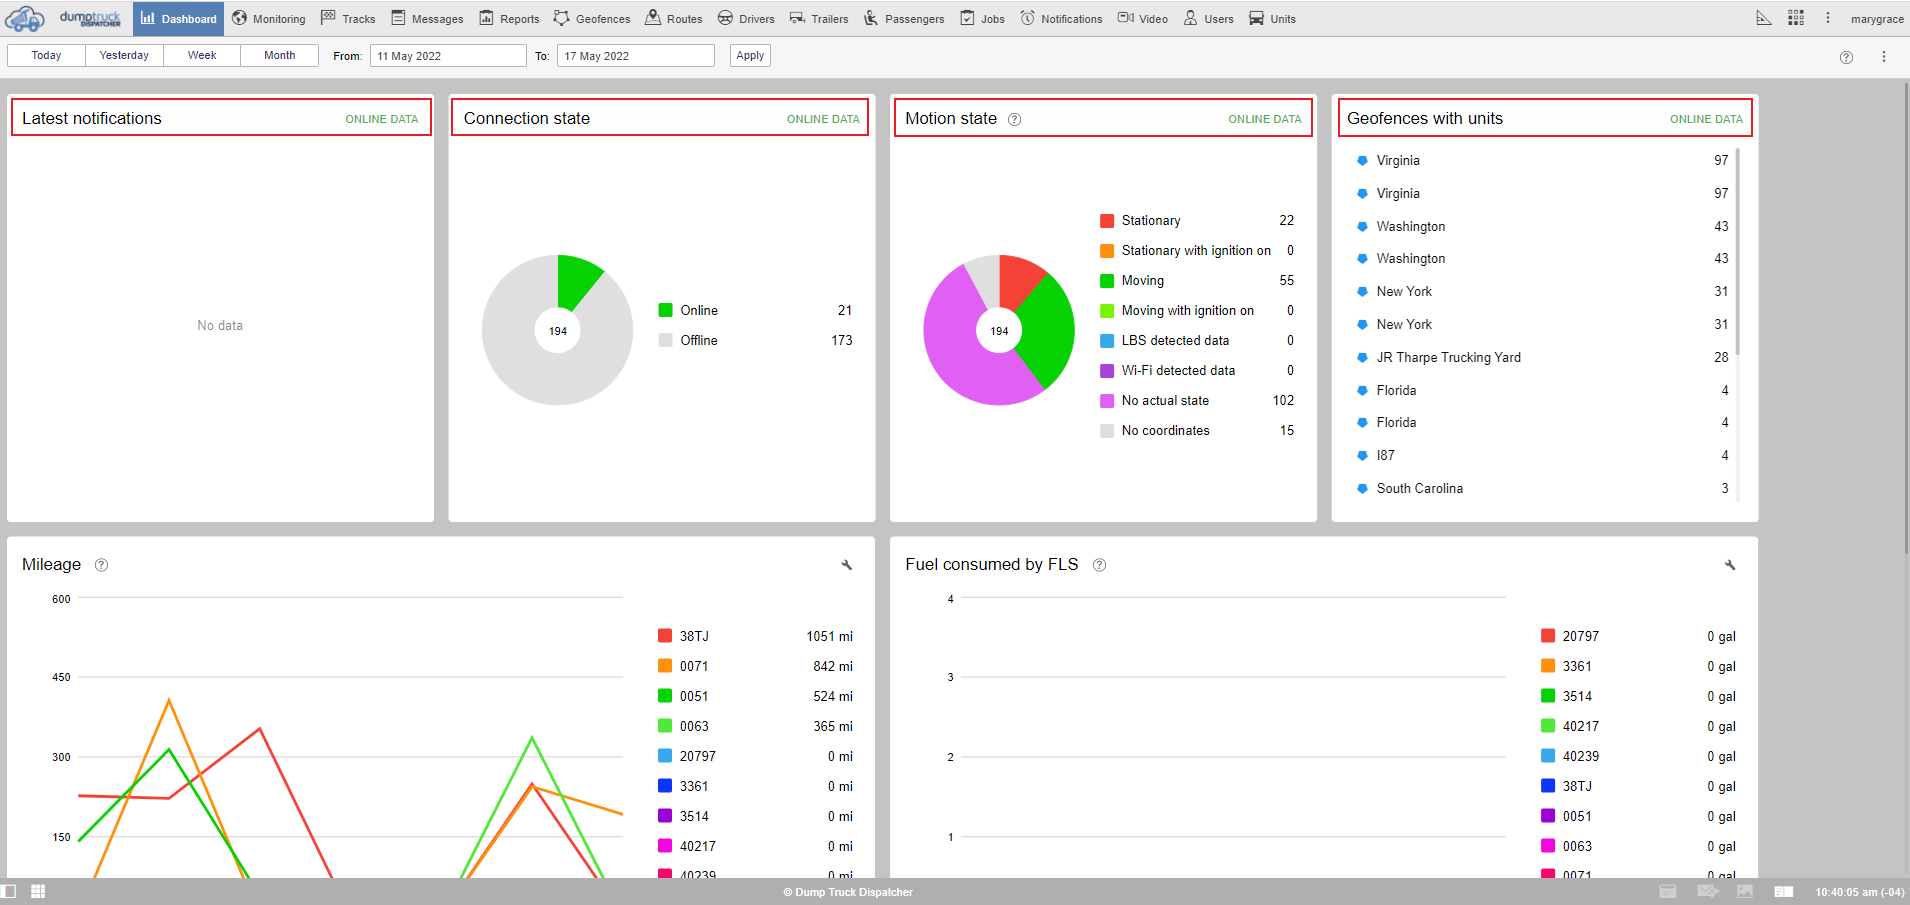
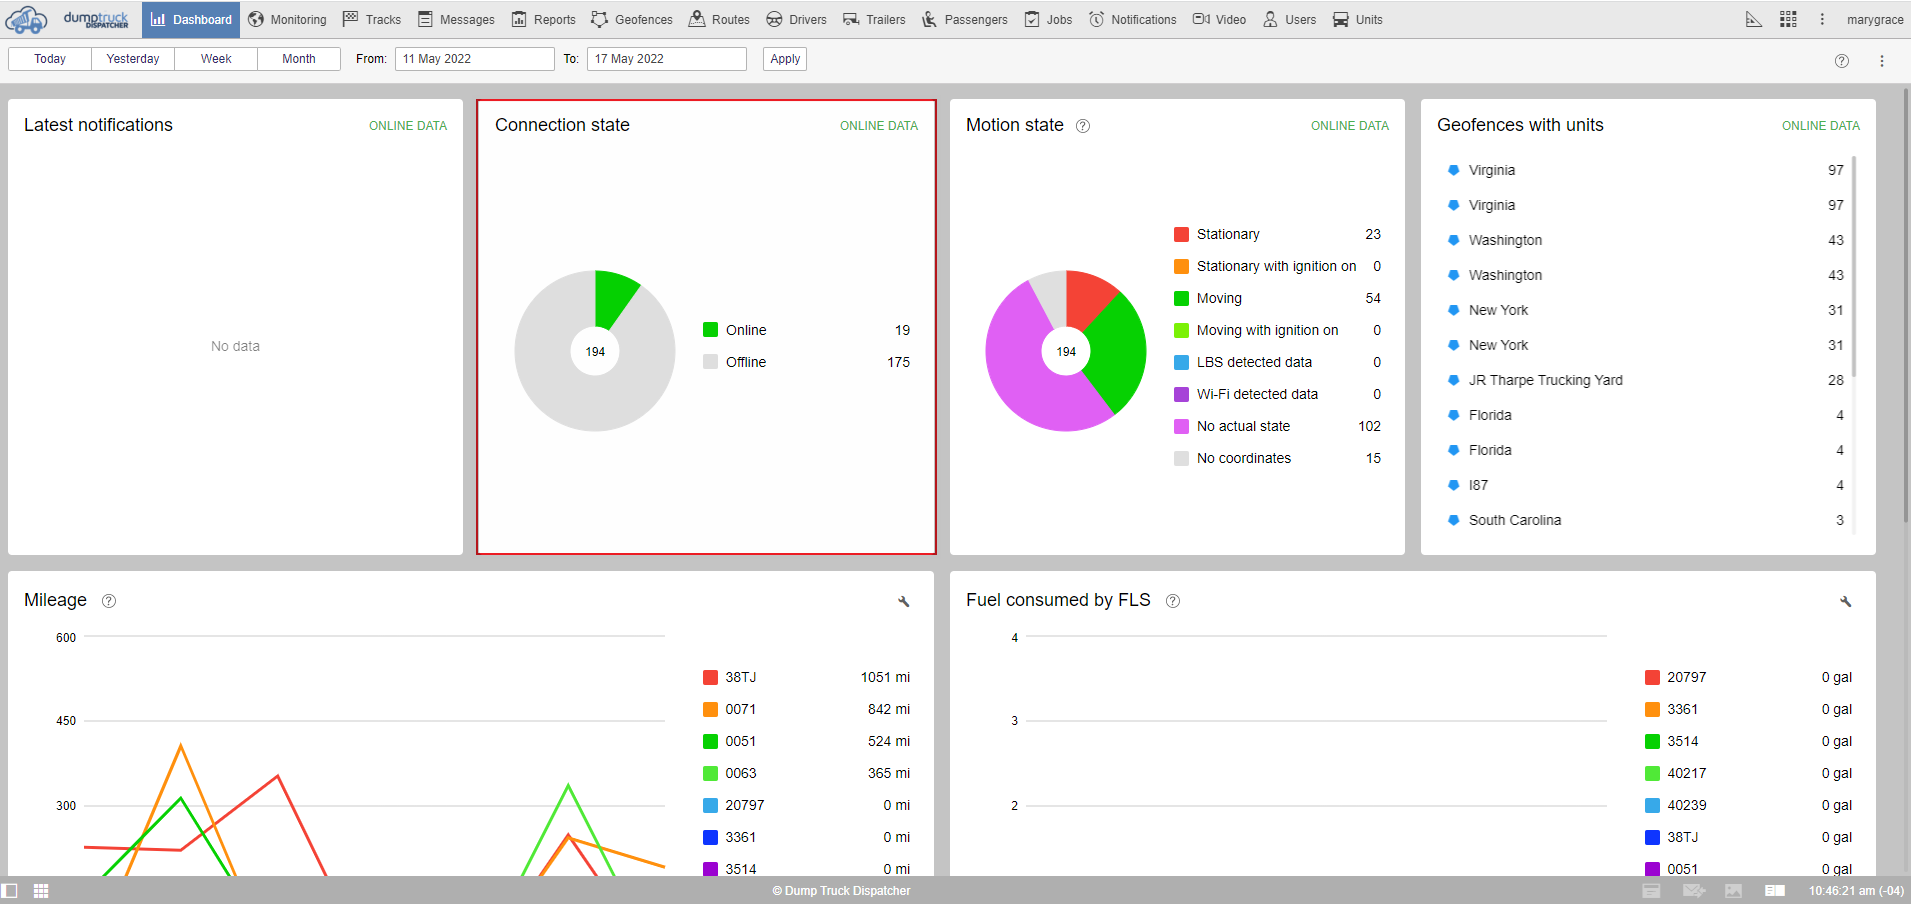
Connection state shows how many of your units are online-offline so you can easily understand how many of the devices are active and quickly spot an error and troubleshoot accordingly.
Motion state shows the summary of all your units motion. There are seven types; stationary, stationary with the ignition on for units that are not moving, moving, and moving with the ignition on for those units that are moving. LBS status for those units which catch zero GPS signal but were configured to report the location of the closest cellular base station. No actual state and no coordinates for units that did not report any data for a long time. Mind that this time period is determined by the admin user.
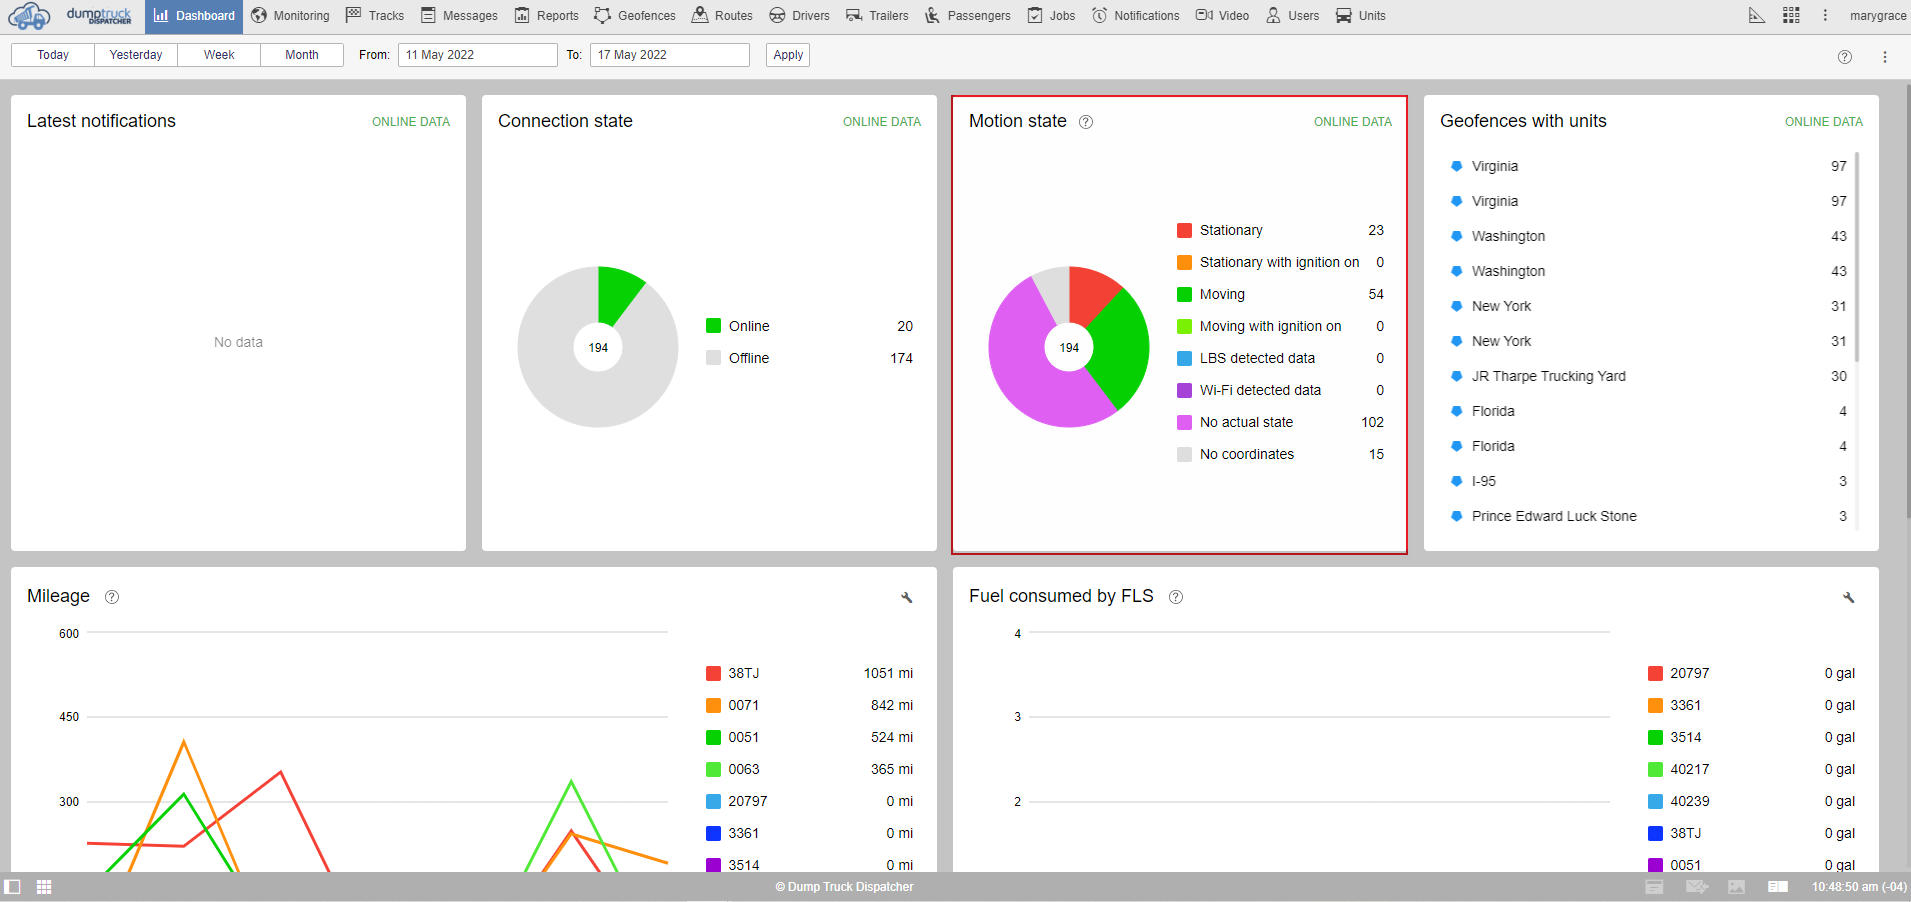
Geofences with unit show how many of your units are inside or outside of a particular geofence.

For example, if you need to make sure that all units are outside or inside a specific area, this is a handy tool to quickly get an overall view and avoid violations.
The latest notification block shows the real-time data on all new notifications received from the moment you logged into the platform.
The next set of blocks is a little different as they are based on historical data. Keep in mind that these panels display information based on one-week data by default.
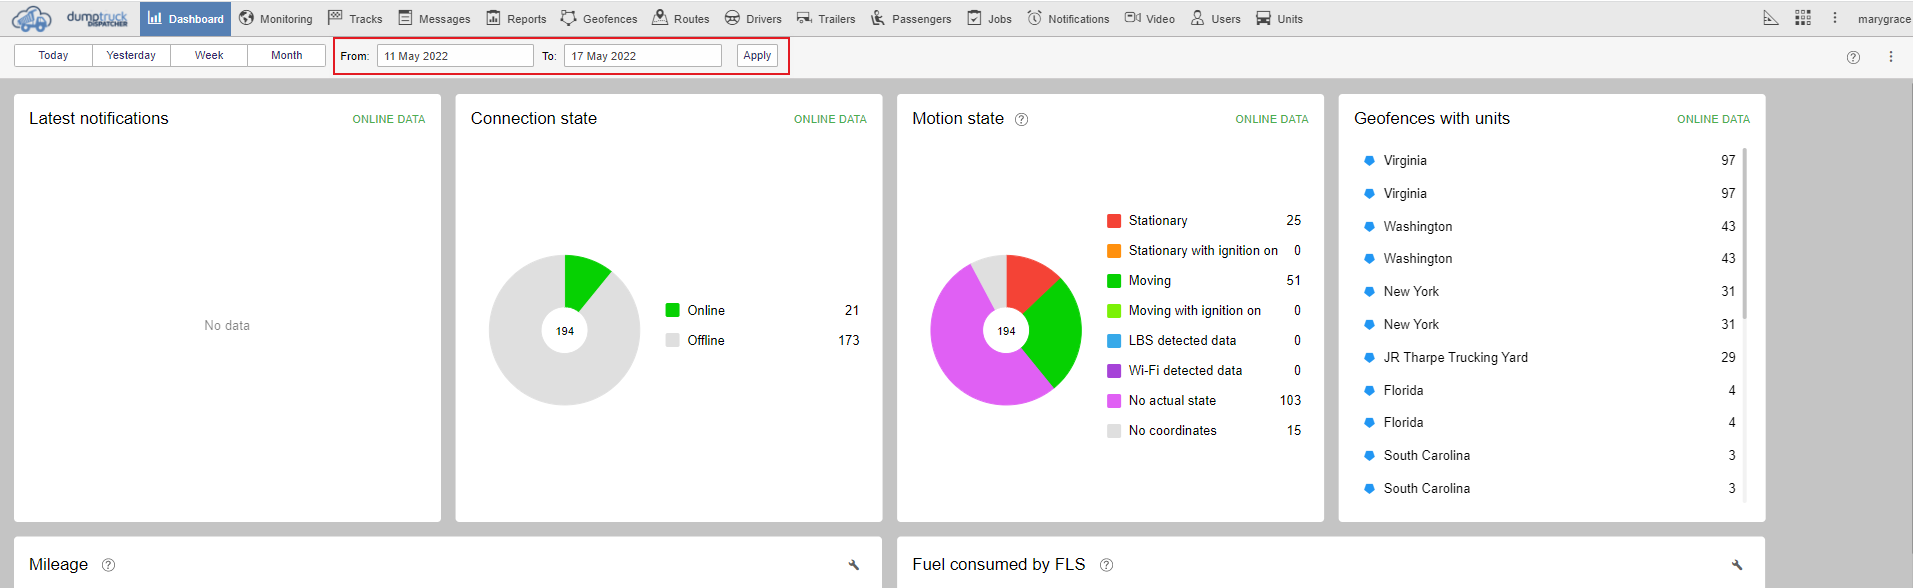
You can choose the time period in the quick date menu. Today, yesterday, week, month, just click the corresponding button to see the data or a specific interval.
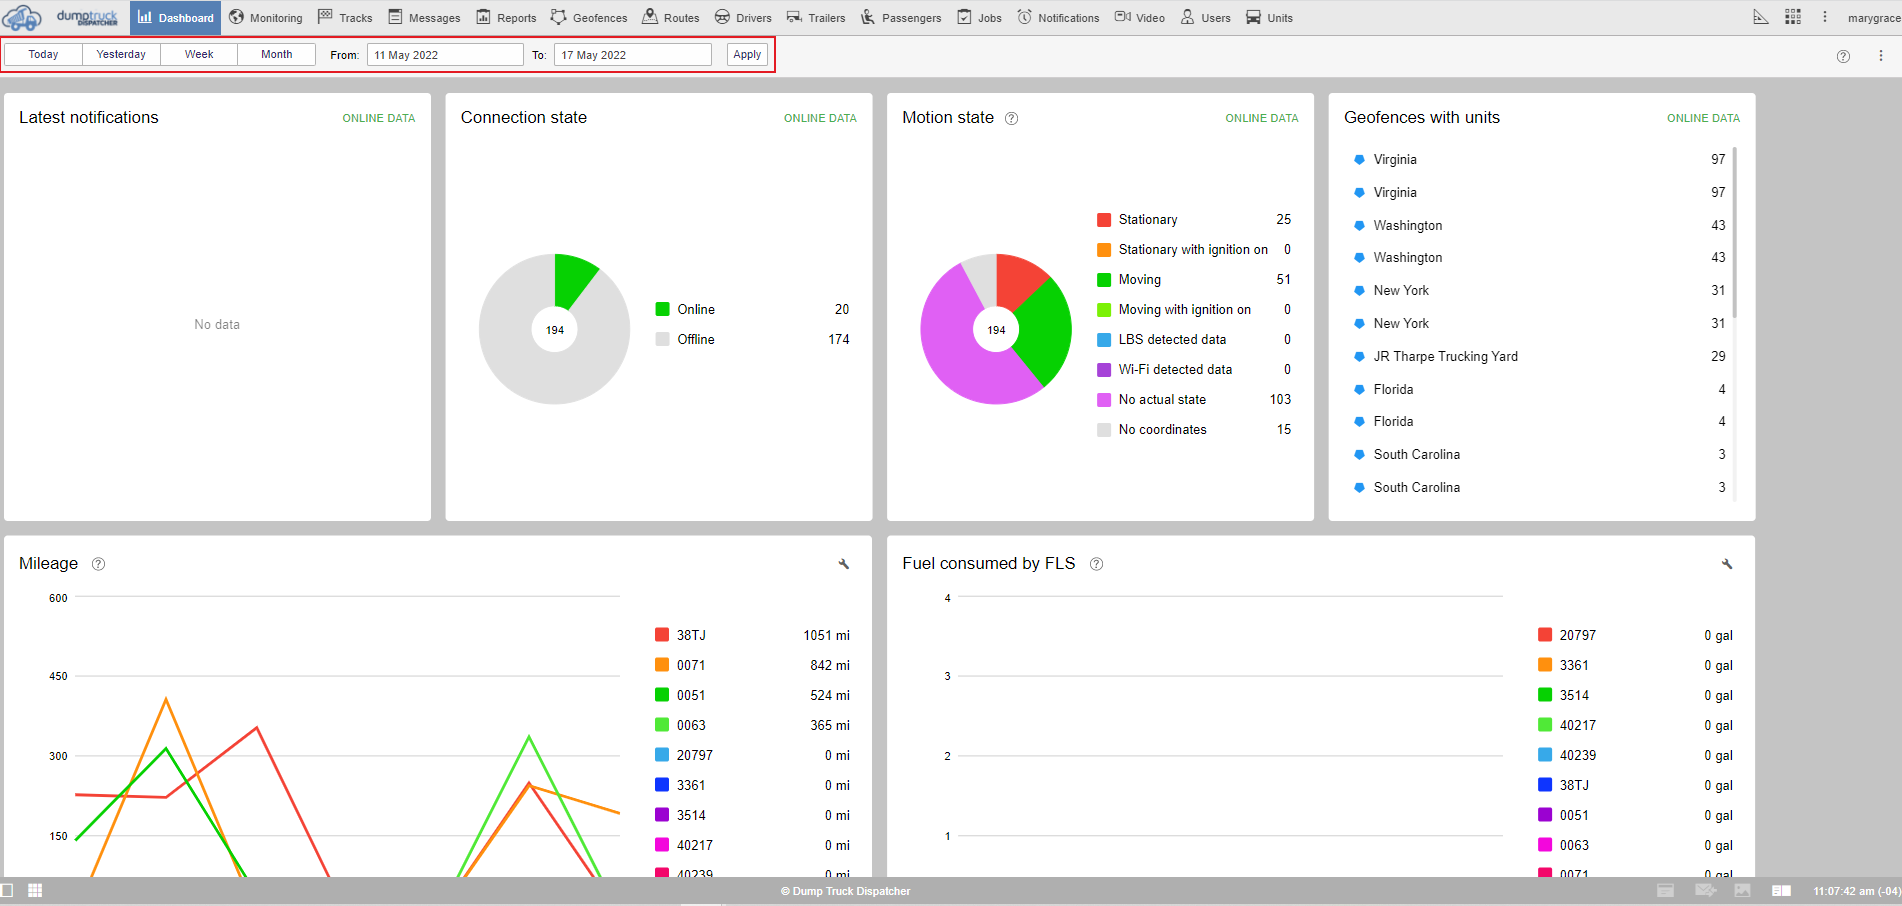
Choose the start and end date and click show.
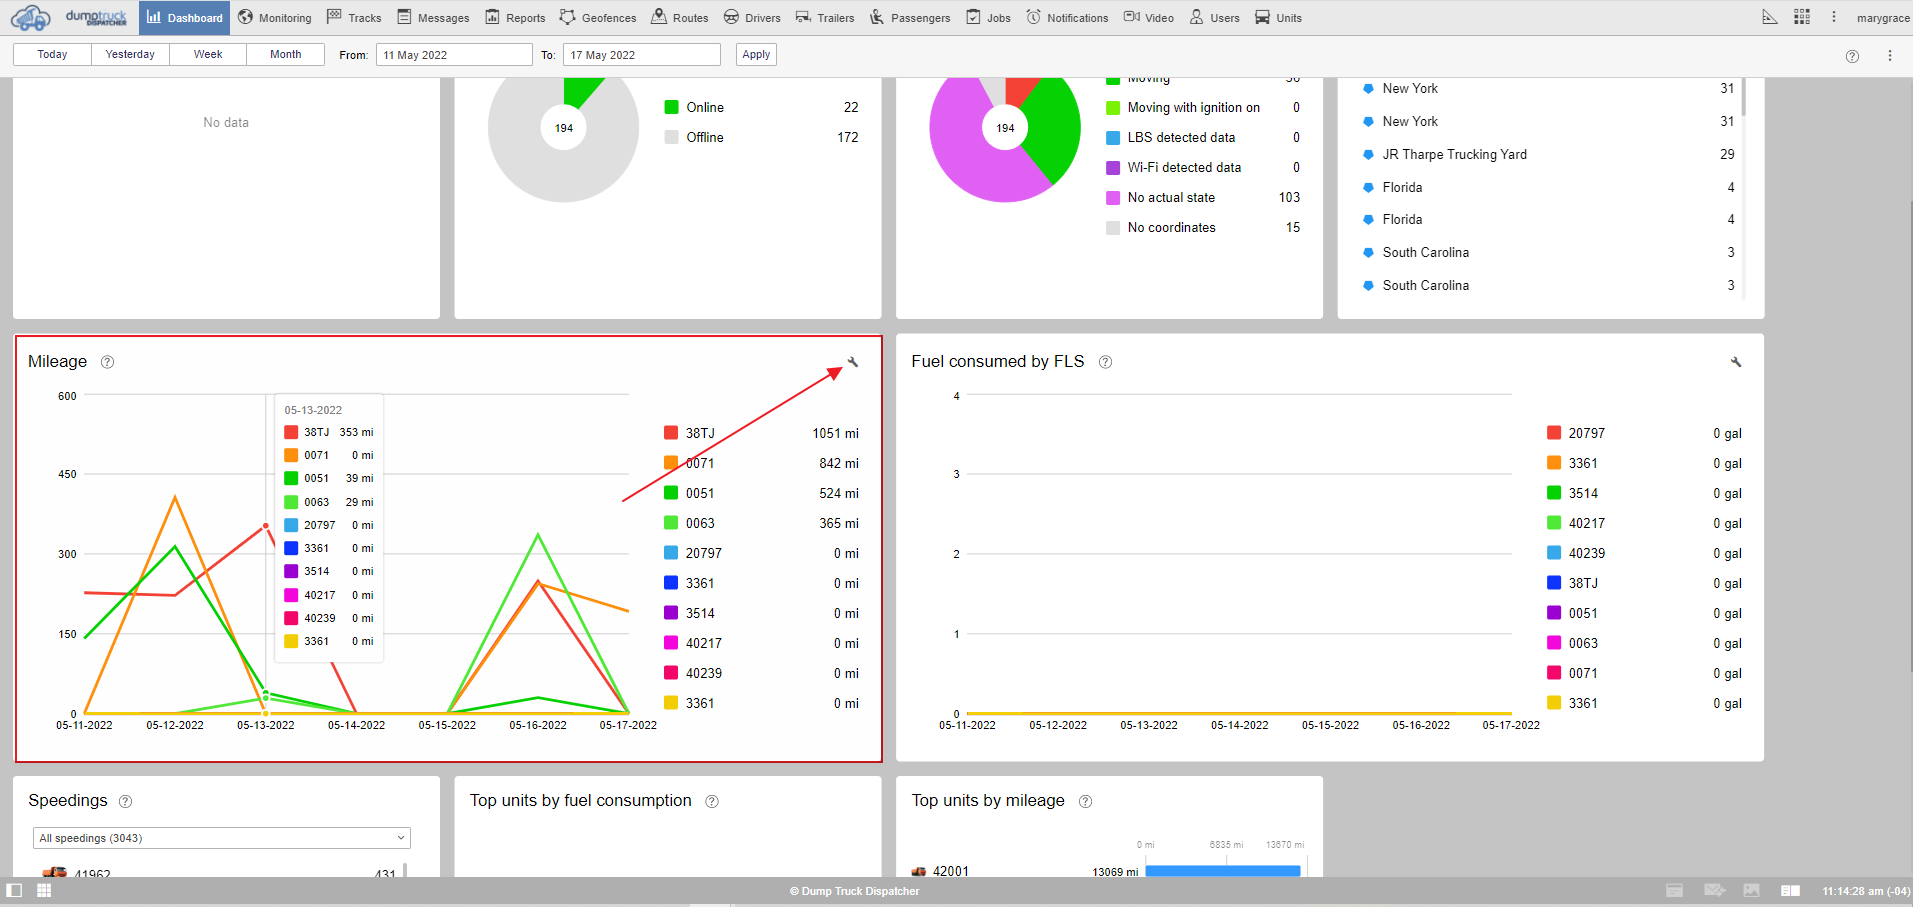
The Mileage shows the mileage of your units. Mileage and fuel consumed are both interactive line charts and can support up to 10 units.
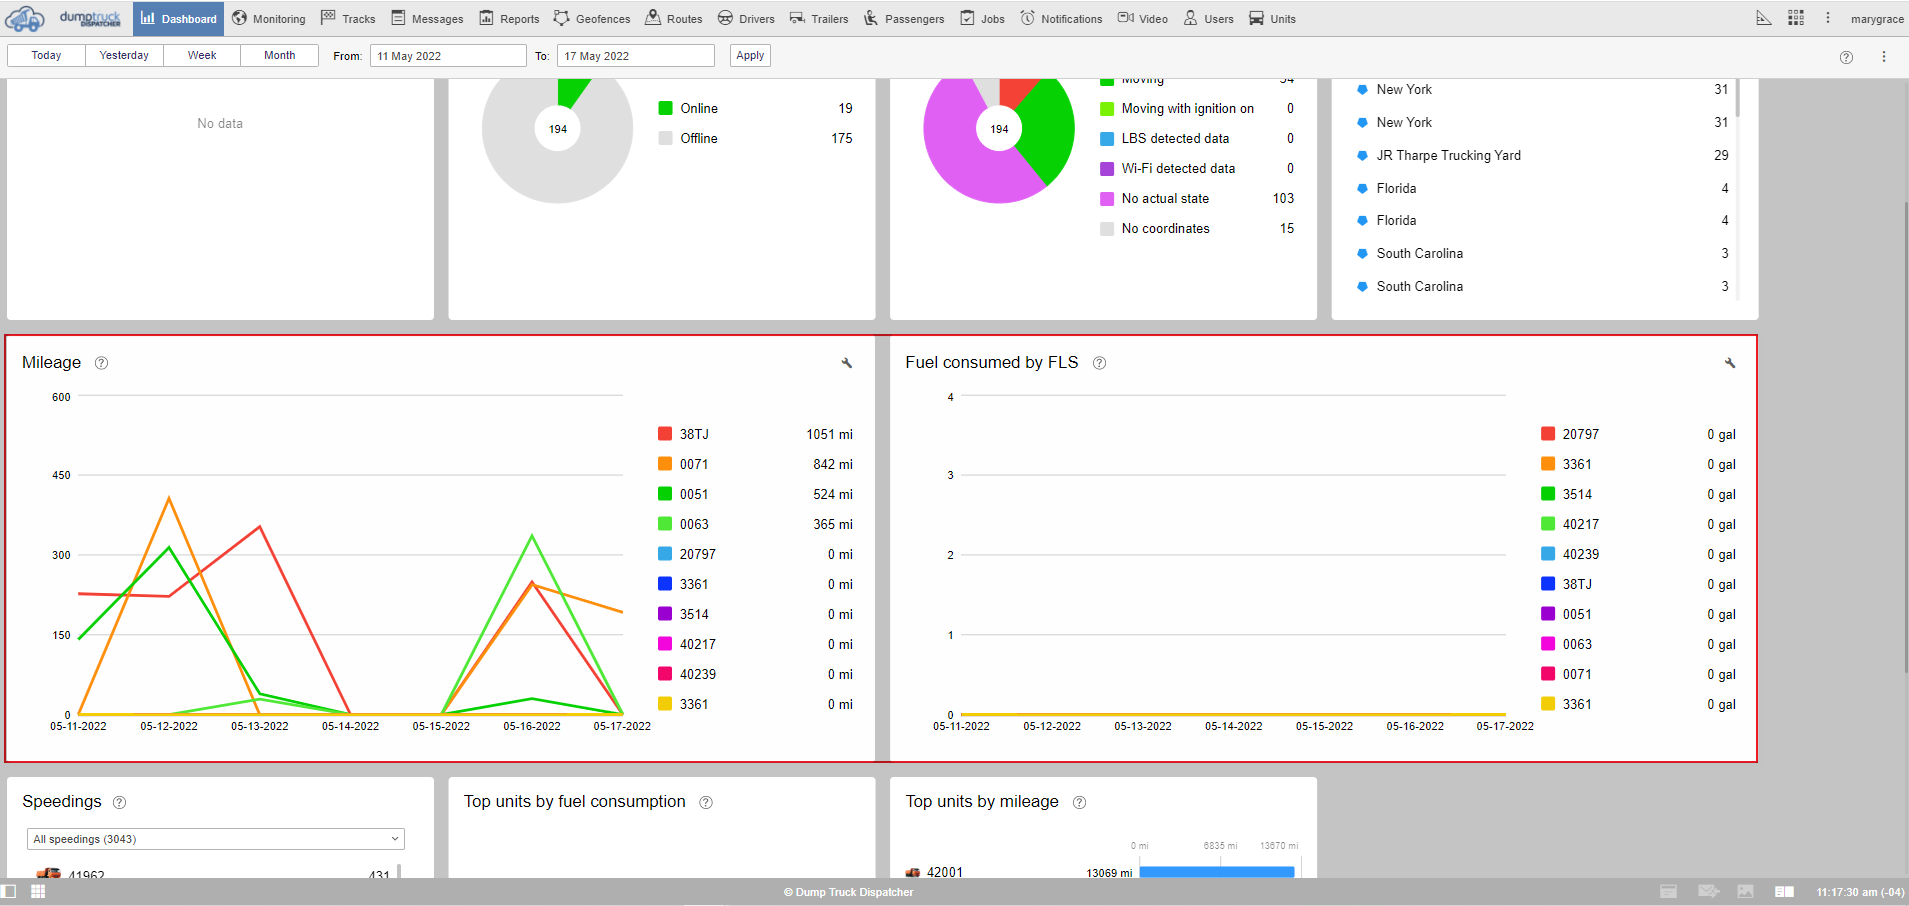
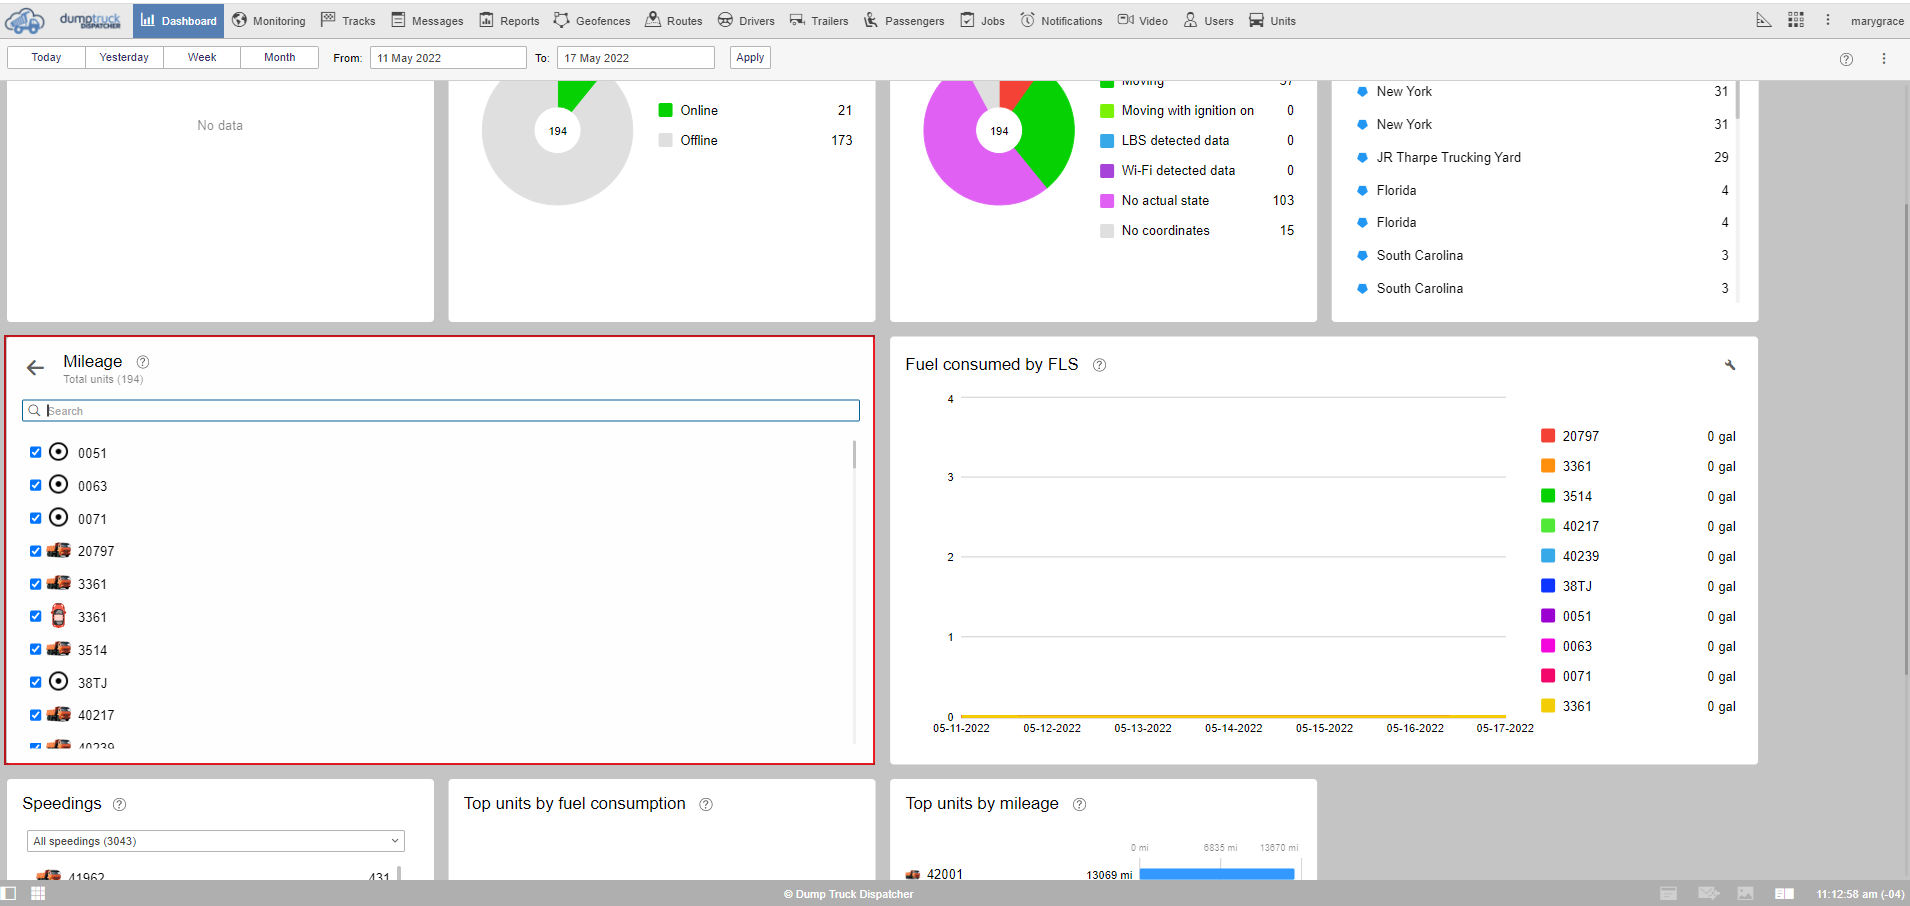
You can customize both by clicking on the edit sign and choosing which units you want to see. You can see the total number of units on this page.
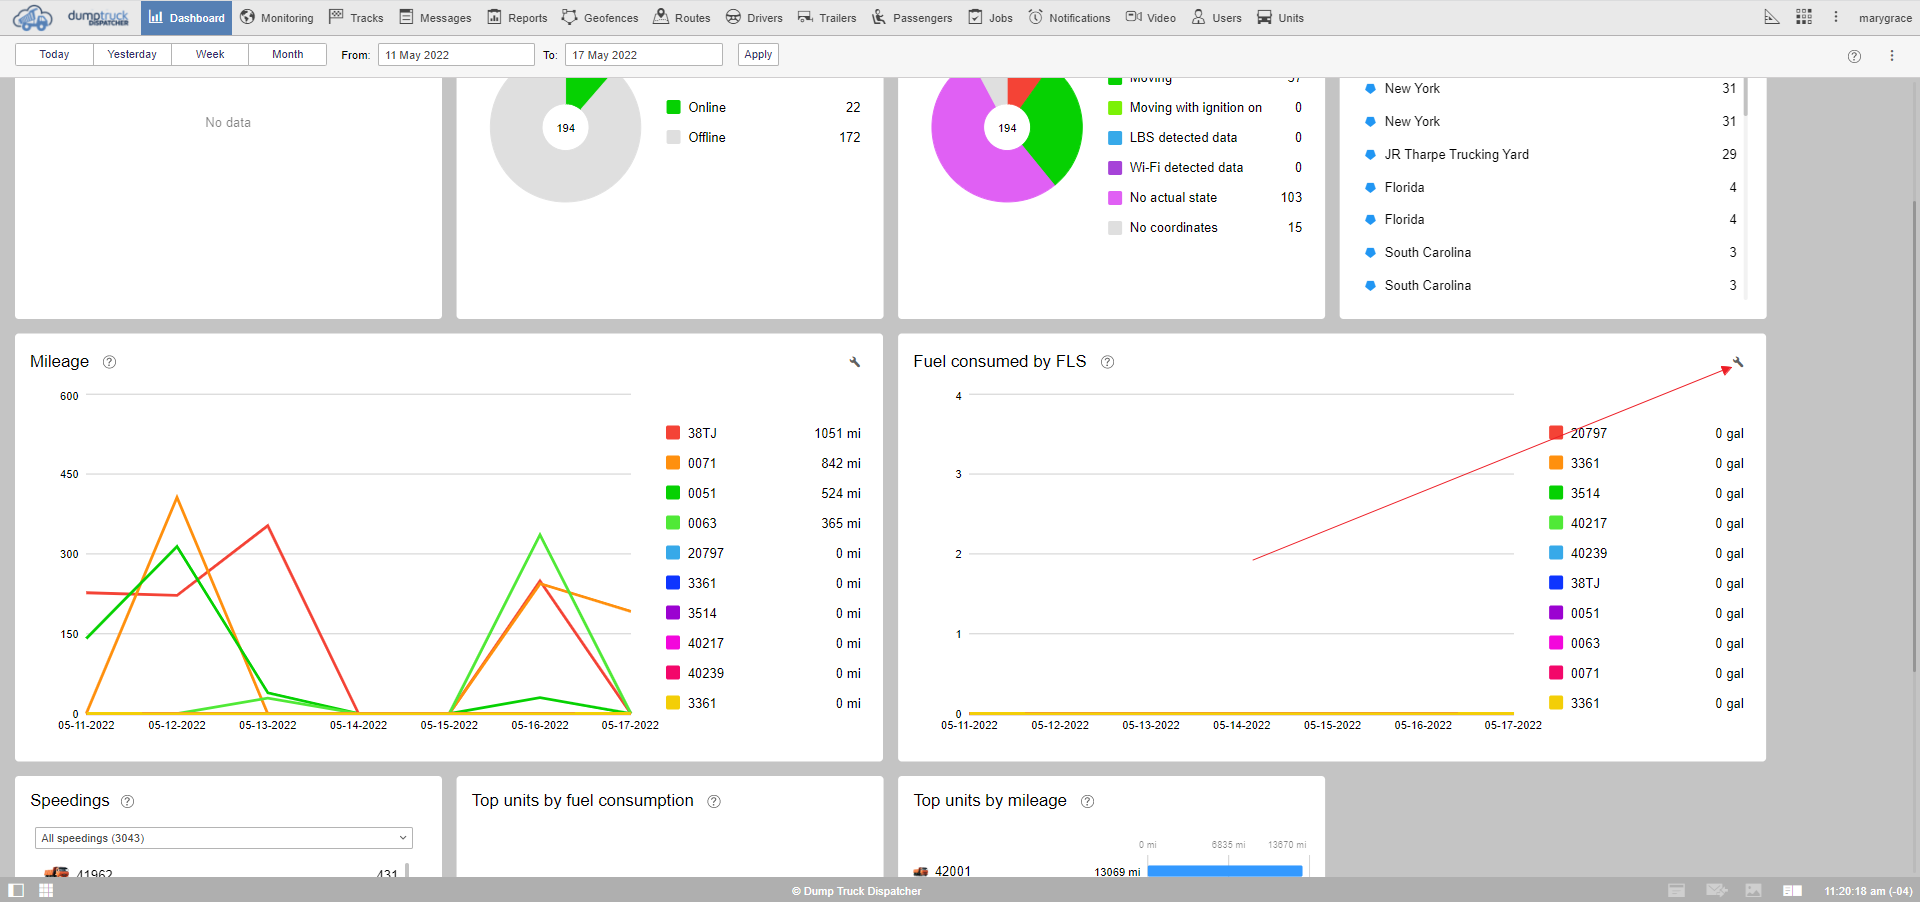
Fuel consumed by FLS or fuel level senor graph shows fuel consumption according to the select time period again, you can customize it by clicking on the edit sign.
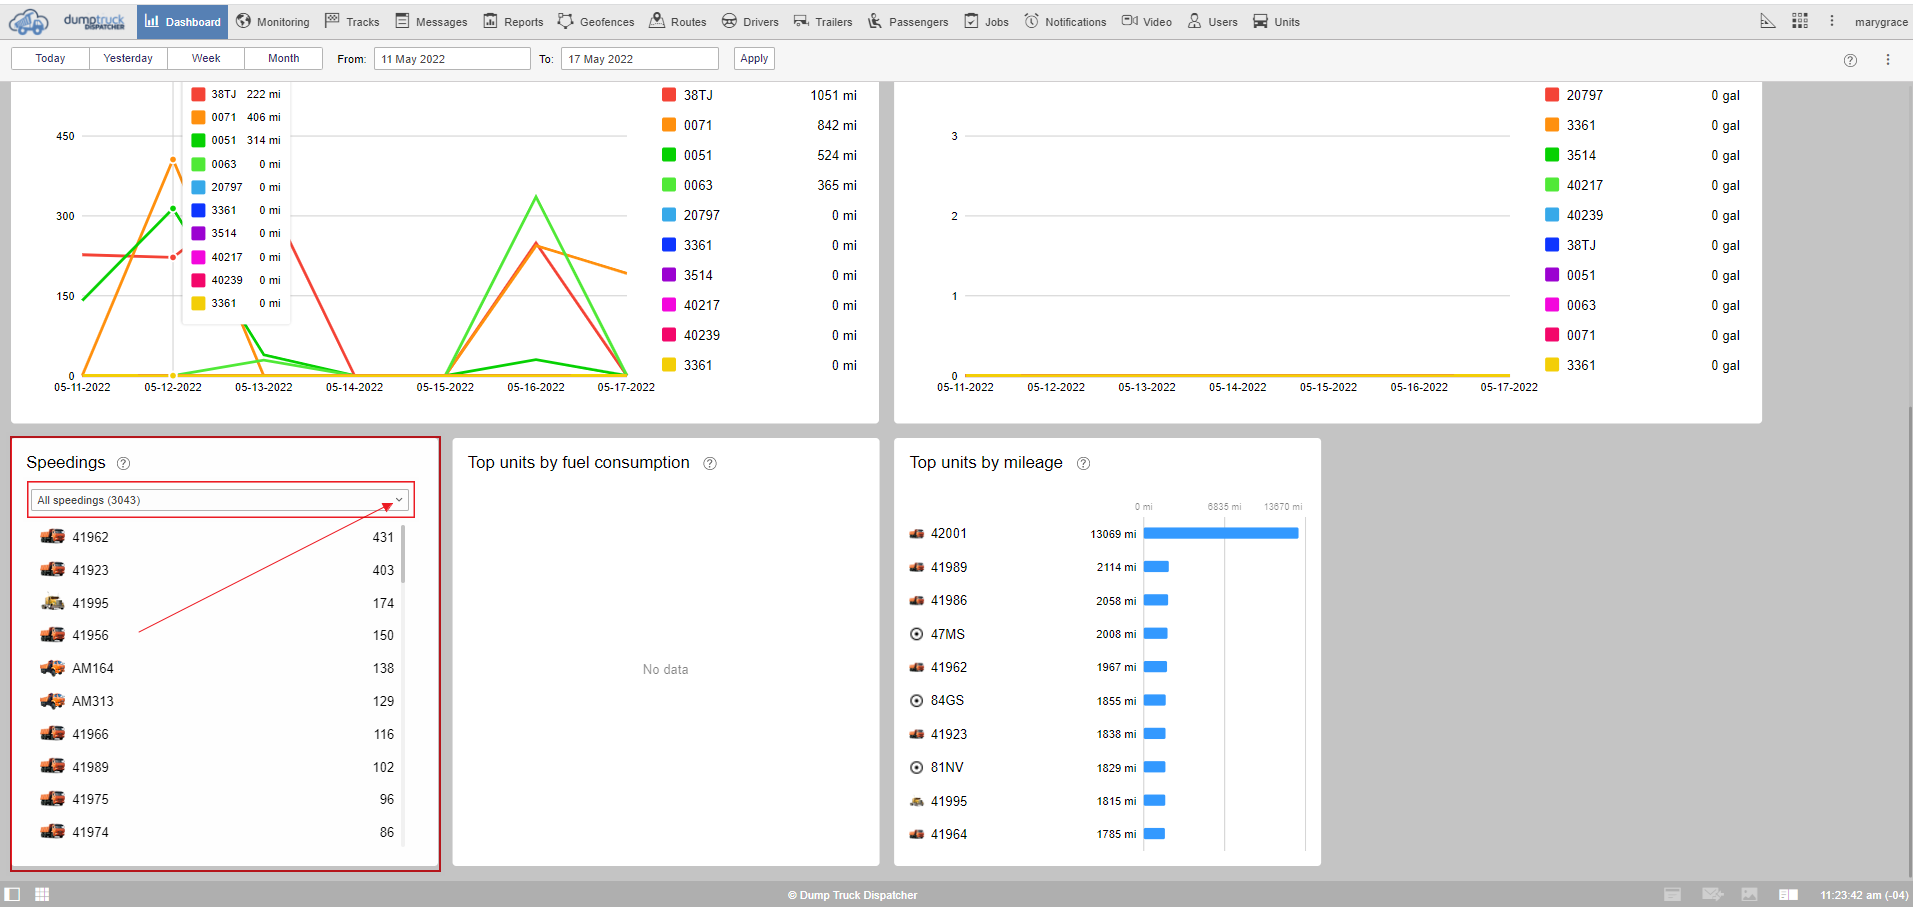
Speeding blocks display information about total speedings and the speeding of each individual unit. Speeding violations are calculated based on posted speed limits. The speed panel is not customizable in the regular sense but you are able to filter violations by overages, from 1 to 10, 10-20, 20-40, and greater than 40 miles over the speed limit.
Please keep in mind that live blocks will always show the current status of the devices and remain unaffected by any input you do to the historical blocks.
